Is Math White?

Unless you’ve been living under a rock, you’ll have heard about the allegations that math perpetuates “white privilege.”  My own take:  While there is some truth to the claim, we must be very careful about what conclusions we draw from them.

For example, part of the claim (nothing new, by the way…I heard the same argument back in the 1990s with the introduction of “multicultural mathematics”) is that names like “the Pythagorean theorem” perpetuate the idea that only white European men can do mathematics.  As a historian of mathematics, I know that “the Pythagorean theorem” was a) not actually discovered by Pythagoras, and b) was independently discovered by several cultures.  And it is my responsibility, as a historian, to set the record straight.

But what about my responsibility as a mathematician?  The issue is this:  when we teach the Pythagorean theorem as mathematicians, we don’t go out of our way to say “Pythagoras was a European white guy.”  What we usually do is to draw a triangle, label some sides, and say “Behold!  a^{2} + b^{2} = c^{2}!”  (Yes, it is a reference…I can’t help myself)

Let’s contrast this to statues of confederate generals.  First, by the standard definition of treason (taking up arms against your country and losing), these folks were traitors, and a statue to Robert E. Lee is no more appropriate than a statue to Benedict Arnold or Nidal Hasan.

But legalistic issues aside, there’s a key difference. And that’s this:  What image pops into your head?  With “Robert E. Lee,” it’s the statue (or some other portrayal), and you know beyond a doubt that he was a European-descended white guy.  In contrast, with “Pythagorean theorem,” the immediate picture is that of a right triangle.

Math transcends nationality, culture, and gender.

But let’s take that a little further.  Part of the claim is that by emphasizing the importance of mathematics, we further disadvantage cultural groups that don’t, as a rule, do well in mathematics.  And that critique is valid…but what conclusion should we draw from it?

Should we conclude that we need to reduce the importance of mathematics?

Or should we instead conclude that it is more important than ever to make sure that all persons, regardless of gender, nationality, culture, sexual orientation, etc., have the opportunity for success in mathematics?


The Geometry of Floods, Part 2

So earlier, I set up the problem:

Suppose a storm dumps volume V of water into a river system. If the water level rises x above its normal level, how far l will it extend beyond its normal boundaries?

Just so you can see how the mind of one mathematician works, here are my notes for when I first came up with the problem:

…which are, of course incomprehensible. Now you know.

Of course, if I were going to put this together for a class, no one would ever see the notes. Instead, they’d see the finished product. It’s the joy of working in the blog format that I can put my notes up just to show the world how badly organized my mind is, and still be able to present a cleaned-up version at the end. I’ll claim it’s inspirational: if he can do math with such a cluttered mindspace, then everyone can do math. (Hmmm…that would make a great title for blog…)

You might remember from geometry (or life) that volume is a three dimensional quantity: you need length, width, and height to describe it. But these drawings are in two dimensions, so you might wonder how we’re going to figure out how far up the riverbed the water flows. The answer rests in something called Cavalieri’s Principle. You can read about it in the Wikipedia article, but the gist is this: The volume of a figure can be found from its cross sections. A good way to visualize this, which the Wikipedia article uses, is to imagine a stacks of coins: the volume of the stack is the same, regardless of whether the coins form a neat stack or whether they are staggered.

Because we’ve assumed uniformity of the cross sections, then the volume of water in the river is going to be proportional to the area of the cross section. Put another way, we don’t need the actual volume; all we need to do is to compare the cross sections. Going back to the stack of coins, if you compare a stack of pennies and a stack of quarters, then provided they have the same height, the volumes of a stack will be proportional to the area of the base coin.

So: In the first house, the cross section of the river is a rectangle, so if the river rises to height x above its normal level, then the volume of water is proportional to wx.

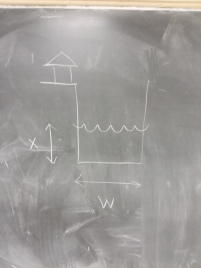
In the second house, the cross section of the river is a rectangle with some triangles attached to it. If the grade is k, then filling this up so that the waterline is l away from the normal river bank will will require a volume proportional to kl^{2} + wkl. I hasten to add that l is the horizontal distance; the actual distance will be slightly greater, as it’s measured along the slope.

Because we’ve assumed the volumes of water poured into the rivers are equal, this means we have a relationship between x$, the height of water in the river around the first house, and l, the distance from the normal riverbank in the river around the second house:

kl^{2} + wkl = wx

(If you look at my notes, you’ll see that I have this same formula on the right hand page…except all the variables are different! Lesson Number One: We change variables a lot, or at least I do)

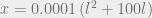
Let’s play around with this equation a little. First, note that we need the square of l, which means that if we want to solve this for l, we’ll need to do some heavy lifting using the quadratic formula. We’ll do that later, but for now, let’s solve this for x instead. First, note that both terms on the left include a factor of k, so we can factor it out:

k (l^{2} + wl) = wx

Next, we can divide by w to get the formula

x = \frac{k}{w} \left(l^{2} + wl\right)

Now k and w are constants: they correspond to the slope of the riverbank up to House 1, and the normal width of the river. Let’s throw in some numbers, just for show.

Suppose w = 100 feet, k = 0.01 (a 1% grade, in road terms). Then

x = 0.0001 \left(l^{2} + 100 l \right)

Suppose you’re living 100 feet from the river bank. With a 1% grade, that puts you a mere 1 foot above the normal river level. We let l = 1, and we find:

x = 0.0001 \left(100^{2} + 100 (100) \right) = 2 feet

What if your house is 200 feet away from the river? Notice that x depends on the square of l. This means that increasing l will have a disproportionate effect on x. In fact, if the water got to you, at a distance of 200 feet from the river, the water would be

x = 0.0001 \left(200^{2} + 200 (100) \right) = 6 feet

above the normal river level…even though you yourself are only 2 feet above it! And if you were 500 feet from the river, in order to reach you, the river would have to be

x = 0.0001 \left(50^{2} + 500(100) \right) = 30 feet

above the normal river level! When building near a river, distance is more important than height.

We can look at it the other way. If you build a levee, you’re essentially building a wall around a river: in effect, you’re setting up the situation around House 2. Now most levees separate the river from ground that has the same elevation as the river.  Here’s my expert drawing of the situation:

A 30-foot high levee is just as effective as putting a minimum of 500 feet between you and the river: any storm that dumps enough water to reach you will overflow the levee.


The Sixth Wave

Over the past four thousand years, four waves of mathematical innovation have swept the world, leading to rapid advances and significant changes in society:

  • The invention of written number (Fertile Crescent, 3000 BC).  This allowed civilization to exist, because if you want to live with more than your extended family, record keeping is essential…and that means keeping track of numerical amounts.
  • The invention of geometry (Greece, 300 BC).  Yes, geometry existed before then; what I’m using is the date of Euclid’s Elements, which is the oldest surviving deductive geometry.  The idea that you could, from a few simple principles, deduce an entire logical structure has a profound impact on society.  How important?  Consider a rather famous line:  “We hold these truths to be self-evident…”  The Declaration of Independence reads like a mathematical theorem, proving the necessity of revolution from some simple axioms.
  • The invention of algebra (Iraq, 900).  The problem “A number and its seventh make 19; find the number” appears in a 4000-year-old manuscript from ancient Egypt, so finding  unknown quantities has a very long history.  What algebra adds is an important viewpoint:  Any of the infinite variety of possible problems can be transformed into one of a small number of types.  Thus, “A farmer has 800 feet of fence and wants to enclose the largest area possible” and “Find a number so the sum of the number and its reciprocal is 8” and “The sum of a number is 12 and its product is 20” can all be reduced to ax^{2} + bx + c = 0 and solved using the quadratic formula x = \dfrac{-b \pm \sqrt{b^{2} - 4ac}}{2a}.
  • The invention of calculus (Europe, 1600).  Algebra is the mathematics of what is.  Calculus is the mathematics of how things change.  Calculus makes physics possible, and from physics comes chemistry and engineering.
  • The invention of statistics (Europe, 1900).  Both algebra and calculus deal with single objects:  a bridge, a number, a moving planet.  But the universe consists of many similar objects:  the human population; the planetary climate; the trash generated by a city.  Statistics aggregates the data on the individual in a way that can be used to describe a population…then uses the information on a population to predict information about an individual.  Everything in modern society, from the pain relievers you use to the road you travel to work, incorporates such a statistical analysis.

Many people, myself included, believe we are on the verge of a sixth wave.  That sixth wave will have the transformative power of calculus and statistics, and fundamentally reshape society.

The sixth wave is based around discrete mathematics.  That’s not mathematics you whisper in dark corners.  Rather, it’s the mathematics of things that can be counted as opposed to measured.  For example, length is continuous:  a length can have any value, and no one looks at you strangely if you say “I traveled 1.38924 miles today…”  (You might get some strange looks, but it’s because you specified the distance so precisely and not because of the distance itself)  But if you continued “…and met 2.35 people,” you would get strange looks, because the number of people you meet is a counted number:  it’s a discrete quantity.

How important is discrete mathematics?  If calculus is the basis for physics and engineering, then linear algebra is the basis for discrete mathematics.  But a first-year calculus problem would have a hard time solving even a simple question in statics (the physics of structures).  In contrast, Google’s search algorithm is based on mathematics learned in the first half of a standard college linear algebra course.

I’ll talk more about this later.  But if you’re interested in learning some linear algebra, the video lectures for the course I teach are available on YouTube.

The Geometry of Floods, Part One

In the aftermath of Hurricane Harvey, there’s bound to be questions asked about the wisdom of building in flood plains.

Part of being a mathematician is asking “What can math say?” A lot of what math can say is embedded in actuarial tables and flood insurance premiums, and phrases like “500 year flood.” Those are good topics, but I’m teaching calculus this semester, so my mind turns to geometry.

Consider two homes. One is built some distance from a river, but only a few feet above the normal water level. Another is very close, but much higher up. Which one is in greater danger of being flooded?

To answer this, we need to construct a mathematical model. We do this by making some assumptions about the world, then follow the math. Since I’ll assume you haven’t taken differential equations and calculus, we’ll construct a relatively simple model based on geometry.

We’ll make the following assumptions:

  • The normal river surface has constant width w. This is unrealistic…but you get what you pay for: a more realistic model is more complex.  (Apologies if that’s not how geologists speak:  I think the last geology course I took listed the Pleistocene as “current events”…)
  • The land between the river and House 1 has a gradual but constant slope, and it’s like this for the entirety of the river. I’ll use my expert drawing skills to show you what I mean:
  • House 2 is built on the riverbanks.  Again, my artistic skills lend to the following:

    As above, we’re assuming the river looks like that for its entirety.
  • We’ll model the storm by dumping volume V of water into each river, and seeing how far it rises up the banks.  In particular, what we want to know is that if the water level rises up x above the riverbed around House 2, how far up does it rise up around House 1:
          vs.    

So here’s the mathematical task:  Suppose the river rises height x about its normal level (the figure on the left).  How far l does it extend past its normal banks (the figure on the right)?

Conversely (mathematicians love this phrase), if you build l away from the normal river bank, how much of a rise above the normal river level are you insulated from?

Now I’m a mathematician…but I’m also a teacher.  And I would be remiss in my duties if I gave you the answer right away.  So mull these over, and I’ll return to the topic next week…


What’s the logo?

abul_heptagon_small

The main logo for the site is shown above, and it’s my current personal favorite geometric construction.  This comes from Abu’l Wafa, a 10th century Persian geometer, and gives a quick-and-easy method of constructing a nearly regular heptagon:

  • Let ABC be an equilateral triangle inscribed in a circle.
  • Bisect BC at D.
  • CD is very nearly the side of a regular heptagon inscribed in the circle.

How close is it?  The green shows what happens when you mark six sides, equal in length to CD, with the seventh side joining the last vertex to your starting point.  The blue is a regular heptagon.  They’re almost indistinguishable.  (The inset shows that the true regular heptagon does deviate very slightly from the approximate regular heptagon)

I actually used this a few years ago, to set up a seven-sided tomato cage.  I’ll leave the details as an exercise for the reader…

Post 0

Welcome to the site!

I brew beer, throw axes, make bobbin lace, tell tales from classical mythology, and engage in card weaving, but on paper, I’m a mathematician who teaches at Brooklyn College, part of the CUNY system.  I’ve been teaching for mumblety-seven years, I’m a survivor of the Great Calculus War (and even fought a few battles), and recently discovered this thing called the internet…

A little while ago, I learned that WordPress supports \LaTeX.  If you don’t know what \LaTeX is, don’t worry…suffice it to say that it’s a way you can typeset mathematical formulas like \sqrt{8} or \frac{1}{3} or even \frac{d}{dx} \left(\sqrt[3]{x^{3} + 5x + 8}\right).   This means that it’s actually possible to do a real math blog, without having to use ASCII graphics or clever HTML hacks or inline GIFs.

So let’s try this and see where it goes.